Introducing Trends
Support traffic changes before your monitoring does. Trends watches what customers are writing about and tells you what moved — with the counts behind every claim.
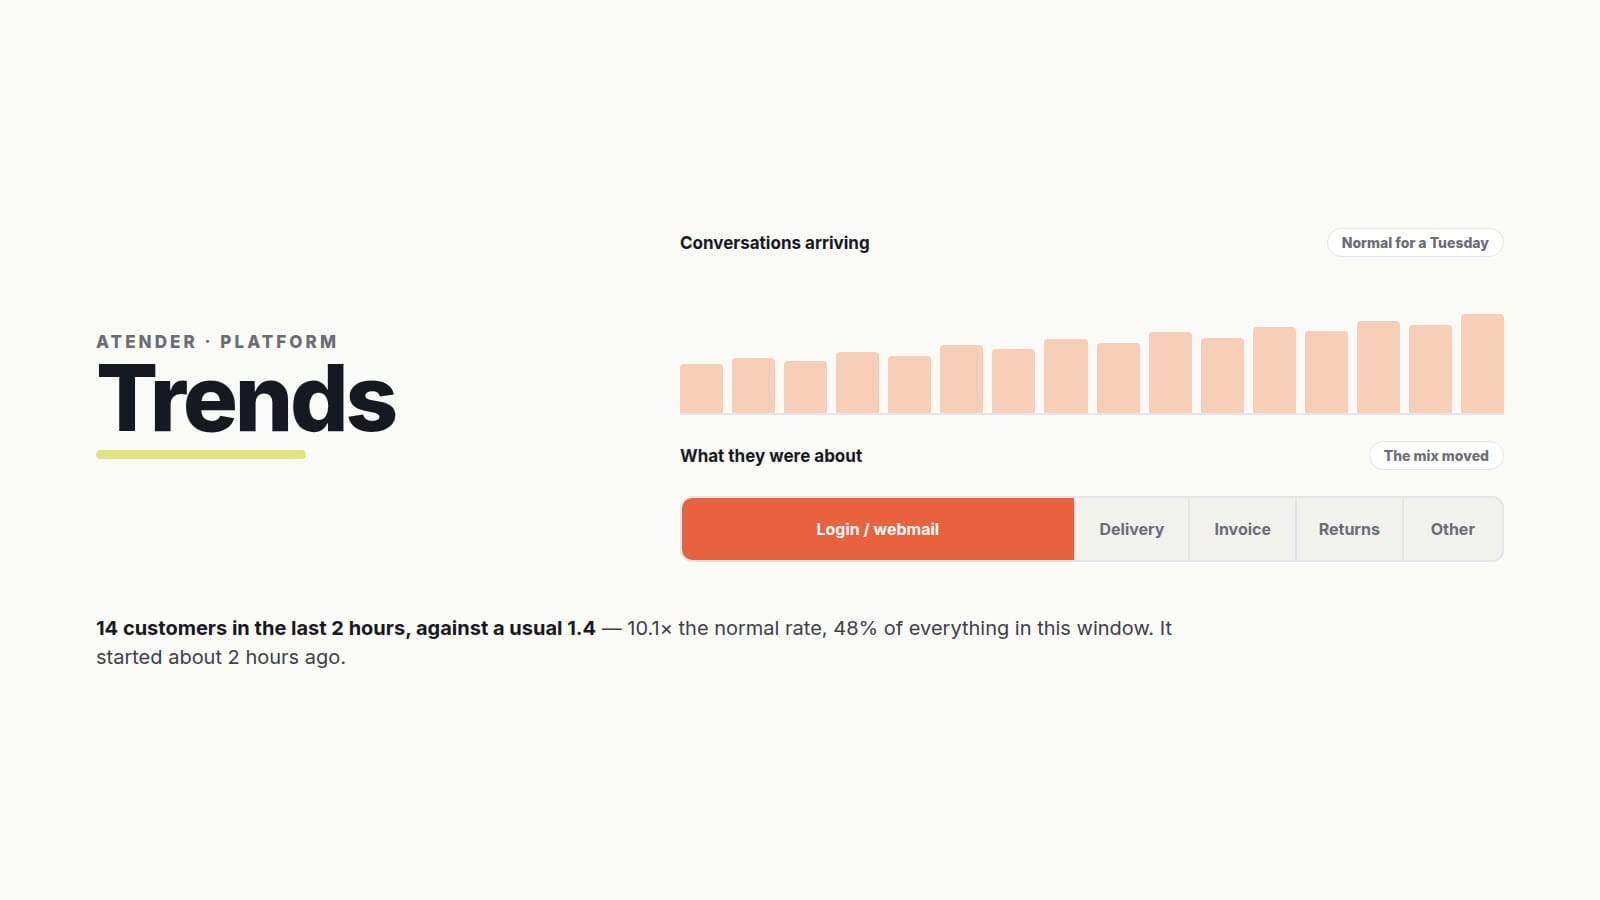
Trends watches what your customers are writing about and tells you when the mix changes, with the counts behind every claim.
Every support team knows the morning where the queue is heavier than usual and nobody can say why. By the time someone works out that thirty conversations this hour are the same failed login, the customers who gave up are already gone.
Trends reads the traffic Atender is already handling, recomputes every five minutes, and puts something on the page only when the counts clear a bar.
Volume and topics
Watch every topic for a spike and you get an alarm for all 150 of them at nine on Monday, because a busy morning lifts everything at once. Nobody keeps a system like that switched on for long.
So Trends asks two questions separately. Is the total unusual for a Tuesday at nine, measured against your own history? Then, using the volume you actually received rather than a forecast of it, is any topic taking a bigger share of it than usual?
Conditioning on the real total is what stops the false alarm. If your traffic doubles and every topic keeps its share, you get one event about volume and silence from everything else. A login outage works the other way round: it barely moves the total, but it takes over the mix, which is how it gets caught in the first twenty minutes.
What counts as normal
Leave a week of login failures in the history and the detector learns that login failures are normal, so the next outage passes unremarked. Windows already flagged as incidents are lifted out of the 28-day baseline before what is usual is worked out.
That removal is capped at about a fifth of the sample, because each one lowers the bar and would flag the next window. Over 62 days of production traffic at four workspaces, the cap cost nothing in recall.
Coverage and limits
Under 30 conversations in a window there is no way to separate a real change in the mix from noise, so Trends says so and reports total volume only. It shows how much of the window carried a tag, says when it is still reading your history, and counts the signals it left off the page rather than dropping them quietly.
How it fits with Analytics
Analytics is what you open to see how the operation is doing over a range you choose. Trends answers what changed in the last two hours to seven days. When a signal turns out to be real, Incidents is where you publish it and keep customers posted, and Monitor is where you watch it land in the live queue.
Because it shows customer text from across the whole workspace, Trends has its own permission: owners, team leads and analytics roles. Agents and readers do not see it.
What’s next
Next, a spike raises an event your automation rules can act on, so it reaches the right Slack channel without anyone watching a page. After that, Trends gets topics of its own, so detection stops depending on how thoroughly a workspace tags.
Available now, per workspace. Trends appears in the main navigation once it is switched on for yours. Want it early? Get in touch and we will enable it. The full breakdown is on the Trends page.